Advanced Automation in Financial Data Analysis with Python and Power BI.
Introduction:
The integration of Python and Power BI is transforming financial data analysis by providing advanced automation, interactive visualizations, and real-time predictive insights. This combination not only reduces the time spent on manual tasks but also empowers financial analysts to make data-driven decisions with greater speed and accuracy. In this article, we will explore how these tools can optimize workflows and deliver deeper insights for modern financial operations.
Key Benefits of Python in Financial Data Analysis:
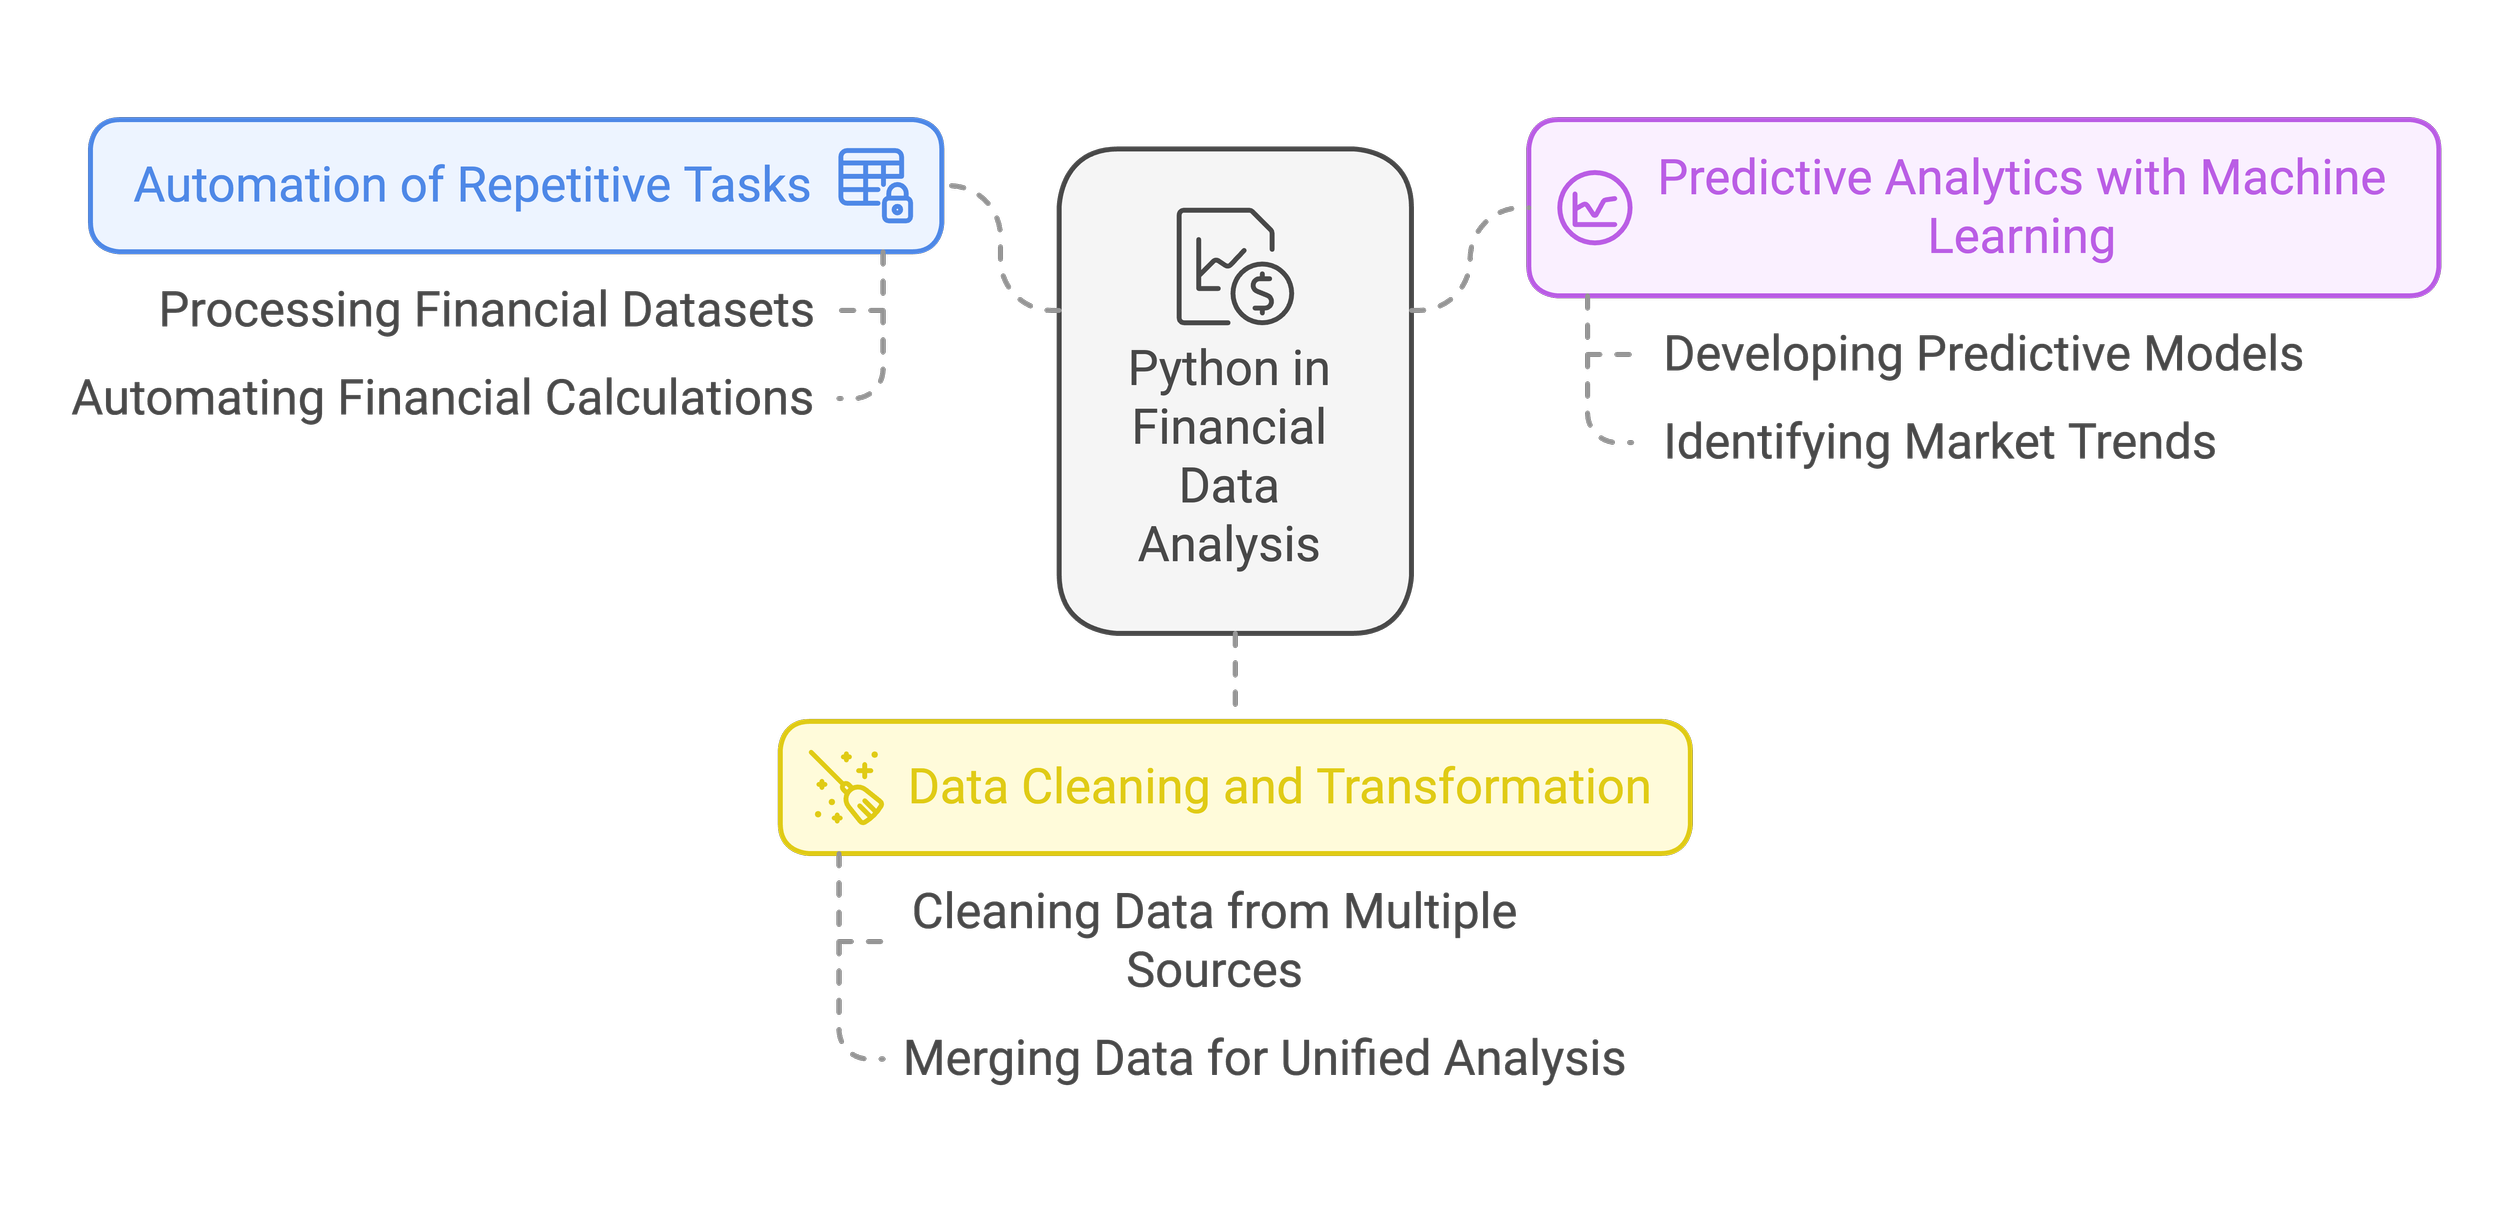
Automation of Repetitive Tasks
Python scripts can process large financial datasets, such as historical transactions, within minutes, freeing up valuable time for strategic analysis.
Example: Automating calculations for financial ratios like ROE and ROA directly from balance sheets and income statements.Predictive Analytics with Machine Learning
Python, combined with libraries like Scikit-learn, allows the development of predictive models to identify market trends and assess financial risks.
Example: Predicting stock price fluctuations based on historical data and market events.Data Cleaning and Transformation
Python excels in data preparation, ensuring high-quality datasets for accurate analysis.
Example: Cleaning and merging data from multiple sources, such as ERP systems and third-party APIs, to create a unified financial dataset.
The Role of Power BI in Automating Financial Reporting:
Dynamic Dashboard Creation
Power BI provides real-time visualizations to monitor key metrics, such as cash flows, profit margins, and operational expenses.
Example: A dashboard that compares projected vs. actual revenue with automatic alerts for deviations.Real-Time Data Integration
With Power BI connectors, analysts can integrate data directly from platforms like SQL databases, ERP systems, or financial market APIs.Data-Driven Storytelling
The ability to generate visual narratives with interactive charts enables finance teams to communicate insights more effectively.
Example: Automatically generated quarterly shareholder reports with KPIs and visual breakdowns.
Case Study:
Financial Optimization in a Tech Company
Challenge: Manual monthly reports consumed over 40 hours and were prone to human errors.
Solution: Python scripts were implemented to clean and transform data, while Power BI dashboards automated the reporting process.
Results: Reporting time was reduced by 70%, accuracy improved significantly, and anomalies were detected in real-time.
Conclusion:
Combining Python and Power BI provides a comprehensive solution for modern financial data analysis. These tools not only enhance accuracy and efficiency but also offer a competitive edge by enabling informed and timely decisions. Implementing this strategy is a critical step for any organization looking to optimize its financial processes in a data-driven environment.
Are you ready to take your financial data analysis to the next level? Contact us to learn how these tools can transform your workflows and unlock new opportunities.


